Light Pollution World Atlas
Are you curious as to how dark your sky is? Or where to go near you for really dark sky?
In 2000, ISTIL, the Light Pollution Science and Technology Institute in Italy, generated The First World Atlas of the zenith artificial night sky brightness at sea level. This atlas was generated using satellite data and modeling of light propogation in the atmosphere.
The technique used to generate this Light Pollution World Atlas is detailed in a paper written in the Monthly Notices of the Royal Astronomical Society. By comparing this Atlas to detailed population density maps, the paper reveals that 2/3 of the world's population and 99% of the US population (excluding Hawaii and Alaska) and 99% of the European Union's population live in light polluted skies. In addition, 20% of the world's populatoin, 67% of that of the US and 50% of that of the EU can no longer can see the Milky Way.
Those are tragic statistics indeed.
Here is the Light Pollution World Atlas :
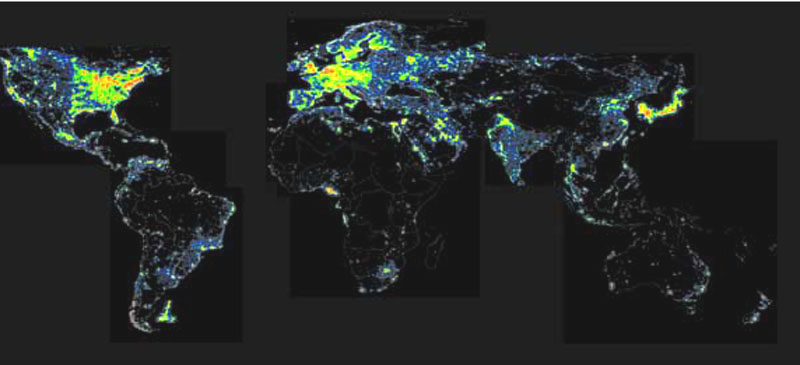
Notice how the US, the EU and Japan are the biggest light pollution offenders, which by no coincidence are the most industrialized regions of the world.
The World Atlas is available at the ISTIL website as a 200MB TIFF image that you can then use to zoom in to your particular area of the world.
The colors in the light pollution maps correspond to the ratio between artificial sky brightness and the natural sky brightness of:
One thing to note is that this map is for ZENITH light pollution, meaning straight up from where you are. If you have a large city to the North (as I do), then your Northern skies will be significantly less than your zenith value.
If you're looking for dark skies, you'll have to consider how dark you really want it. And even if the area you choose is considered Dark Gray, be sure you don' t have any White areas too close or you will lose that part of your non-zenith sky.
Good (dark and clear) night!
In 2000, ISTIL, the Light Pollution Science and Technology Institute in Italy, generated The First World Atlas of the zenith artificial night sky brightness at sea level. This atlas was generated using satellite data and modeling of light propogation in the atmosphere.
The technique used to generate this Light Pollution World Atlas is detailed in a paper written in the Monthly Notices of the Royal Astronomical Society. By comparing this Atlas to detailed population density maps, the paper reveals that 2/3 of the world's population and 99% of the US population (excluding Hawaii and Alaska) and 99% of the European Union's population live in light polluted skies. In addition, 20% of the world's populatoin, 67% of that of the US and 50% of that of the EU can no longer can see the Milky Way.
Those are tragic statistics indeed.
Here is the Light Pollution World Atlas :
Notice how the US, the EU and Japan are the biggest light pollution offenders, which by no coincidence are the most industrialized regions of the world.
The World Atlas is available at the ISTIL website as a 200MB TIFF image that you can then use to zoom in to your particular area of the world.
The colors in the light pollution maps correspond to the ratio between artificial sky brightness and the natural sky brightness of:
- Black <0.01
- Dark Gray 0.01 - 0.11
- Blue 0.11 - 0.33
- Green 0.33 - 1
- Yellow 1 - 3
- Orange 3 - 9
- Red 9 - 27
- White > 27
One thing to note is that this map is for ZENITH light pollution, meaning straight up from where you are. If you have a large city to the North (as I do), then your Northern skies will be significantly less than your zenith value.
If you're looking for dark skies, you'll have to consider how dark you really want it. And even if the area you choose is considered Dark Gray, be sure you don' t have any White areas too close or you will lose that part of your non-zenith sky.
Good (dark and clear) night!
posted by Dan at 10:00 PM
![]()
![]()


0 Comments:
Post a Comment
<< Home